Did you know that the average marketer has five tools in their tool stack?
We use a combination of SEO, email, and social listening tools. And while all of them offer some great insight, they can set you back a small fortune.
So, the question is: Can you build a content marketing dashboard with free-to-use tools?
The answer is yes. In fact, you can use one that’s probably already in your tool stack: Google Analytics. Below are the top 5 Google Analytics Metrics you must include in your content marketing dashboard.
1. Average Session Duration
Good content keeps people on your website for longer.
That’s why you should add your site’s average session duration to your content marketing dashboard, as Daniela Andreevska of Mashvisor explains: “You should continuously track [this metric] to know which type of content keeps your users engaged for the longest.”
"The longer they stay on your website, the more likely tehy are to come back and actually become customers."
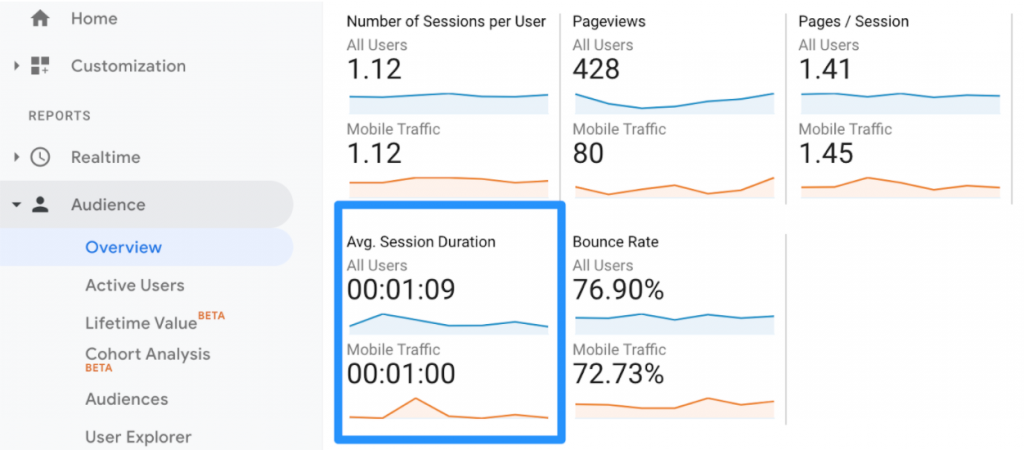
Find this by heading to Audience > Overview.
The default setting will show your average session duration for all of your site visitors. However, you can use segments to change the audience type—such as organic visitors, those who made a purchase, or mobile users:

2. Bounce Rate
Bounce rate is the percentage of people who arrived on your website and exited immediately, without visiting another URL.

“A high or an increasing bounce rate is a clear sign that your content doesn’t interest your target audience and that you need to make changes to it.”
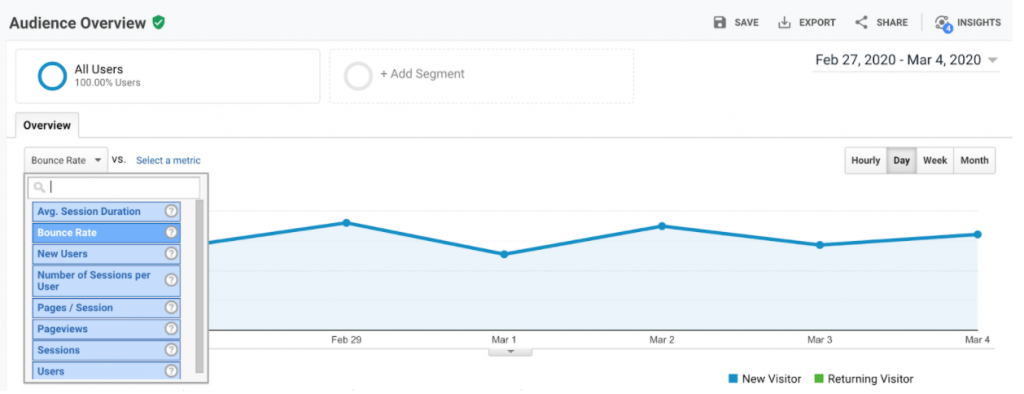
Again, you can view this in the Audience Overview tab.
See how your bounce rate changes over time by changing the default Users setting to Bounce Rate:

3. Goal Completions
You can create Goals inside Google Analytics to track when someone completes an action, such as:
• Submitting a form
• Watching a video
• Purchasing a product
According to Alistair Dodds of Ever Increasing Circles, “there needs to be a measurable outcome to your content—be it engagement, time on page, shares, lead magnet and newsletter sign-ups, and so on.”

There needs to be a measurable outcome to your content—be it engagement, time on page, shares, lead magnet and newsletter sign-ups, and so on.
Set-up Goals in your Google Analytics account. Then, head to the Conversions tab to see how many people are completing them:

4. Sessions from Organic Search
Sometimes, you don’t need expensive SEO software to understand how you’re performing.
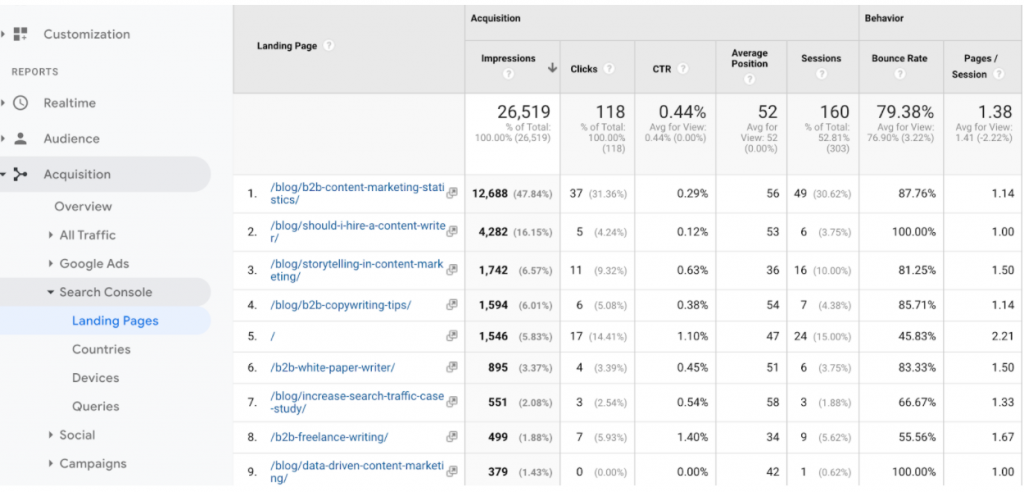
Inside your Google Analytics, filter your data to see all of the landing pages that visitors got to from organic search. By examining this data, you can see whether or not the content you created actually attracted visitors
Bear in mind that you’ll need to connect your Google Search Console for this—another free tool you can use to collect data:

For acquiring organic traffic, you must start with Keyword Research. In this regard, definitely check out the below guide:
5. New vs. Returning Visitors
“If you are a content marketer, the hope is that you offer valuable content to your audiences to establish relationships—one in which they would return for more value, perhaps to buy a service or product,” says Melissa Hughes of @foundationincco
While it’s great to have a bunch of new people landing on your content, returning visitors show there are people who genuinely enjoy what you’re posting.
You can track whether this is happening with your content by heading to Audience > Behavior > New vs. Returning Visitors:
Final Thoughts
As you can see, there’s a ton of valuable data inside Google Analytics that you can use when creating a content marketing dashboard.
Don’t forget about the basics when creating your own. Sure, you might be spending some money on SEO tools or figuring out how to write awesome content—but Google Analytics is a superb resource you should be taking advantage of. Especially since it’s totally free.

